One R Tip A Day: How to draw a plot with two Y axises and one X axis
par(mar=c(4, 5, 4, 5) + 0.1)
plot(y1, type='b', col='gray', ylim=range(c(y1, y2)), ylab="y")
lines(y2, type='b', pch=19)
# draw the other Y axis
par(usr=c(par("usr")[1:2], range(Y)))
lines(Y, type='b', pch=20, col='blue')
axis(4, col.axis='blue')
# manually label the other Y axis
mtext(side=4, line=1, 'Y', col='blue')
legend('topleft', c("y1", "y2", "Y"), pch=c(19, 1, 20), col=c('black', 'gray', 'blue'), lty=1)
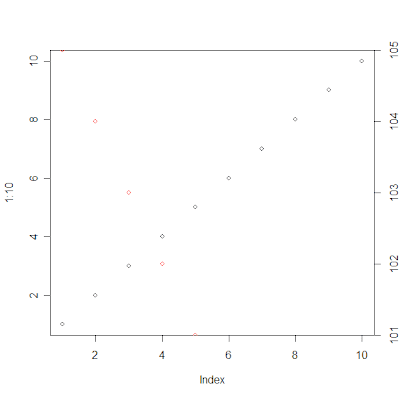
plot(1:10)
par("usr")
# [1] 0.64 10.36 0.64 10.36
# Now resetting y axis' usr coordinates:
par(usr=c(par("usr")[1:2], 101, 105))
points(1:5, 105:101, col="red")
axis(4)
par(mar=c(4, 5, 4, 5) + 0.1)
plot(y1, type='b', col='gray', ylim=range(c(y1, y2)), ylab="y")
lines(y2, type='b', pch=19)
# draw the other Y axis
par(usr=c(par("usr")[1:2], range(Y)))
lines(Y, type='b', pch=20, col='blue')
axis(4, col.axis='blue')
# manually label the other Y axis
mtext(side=4, line=1, 'Y', col='blue')
legend('topleft', c("y1", "y2", "Y"), pch=c(19, 1, 20), col=c('black', 'gray', 'blue'), lty=1)
A very smart way, rather than transforming one Y axis range to the other Y axis range by math formula.
#Y = (Y-min(Y))*(max(y1, y2) - min(y1, y2))/(max(Y)-min(Y)) + min(y1, y2)
#Y = (Y-min(Y))*(max(y1, y2) - min(y1, y2))/(max(Y)-min(Y)) + min(y1, y2)
No comments:
Post a Comment