"... the bottom and top of the box are always the 25th and 75th percentile (the lower and upper quartiles, respectively), and the band near the middle of the box is always the 50th percentile (the median). But the ends of the whiskers can represent several possible alternative values..."In R's default boxplot{graphics} code,
upper whisker = min(max(x), Q_3 + 1.5 * IQR)
lower whisker = max(min(x), Q_1 - 1.5 * IQR)
where IQR = Q_3 - Q_1, the box length.
So the upper whisker is located at the *smaller* of the maximum x value and Q_3 + 1.5 IQR,
whereas the lower whisker is located at the *larger* of the smallest x value and Q_1 - 1.5 IQR.
The range can be adjusted via argument range in boxplot() function, whose default value is 1.5. Here is what's described in the boxplot() document:
range | this determines how far the plot whiskers extend out from the box. If range is positive, the whiskers extend to the most extreme data point which is no more than range times the interquartile range from the box. A value of zero causes the whiskers to extend to the data extremes. |
Here is a full discussion about the whisker of boxplot in default R code:
http://r.789695.n4.nabble.com/Whiskers-on-the-default-boxplot-graphics-td2195503.html
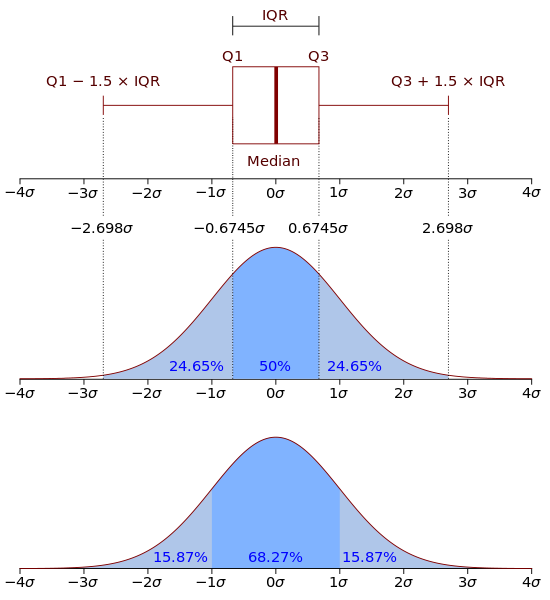
Here is a useful plot from wikipedia for better understanding the boxplot by comparing the box plot against the probability density function (theoretical histogram) for a normal N(0,1σ2) distribution.
No comments:
Post a Comment